Intro
But I love my terminal!
Discuss the need for the dashboard, why I decided to implement one, how I decided what should be included
Nav
Overview
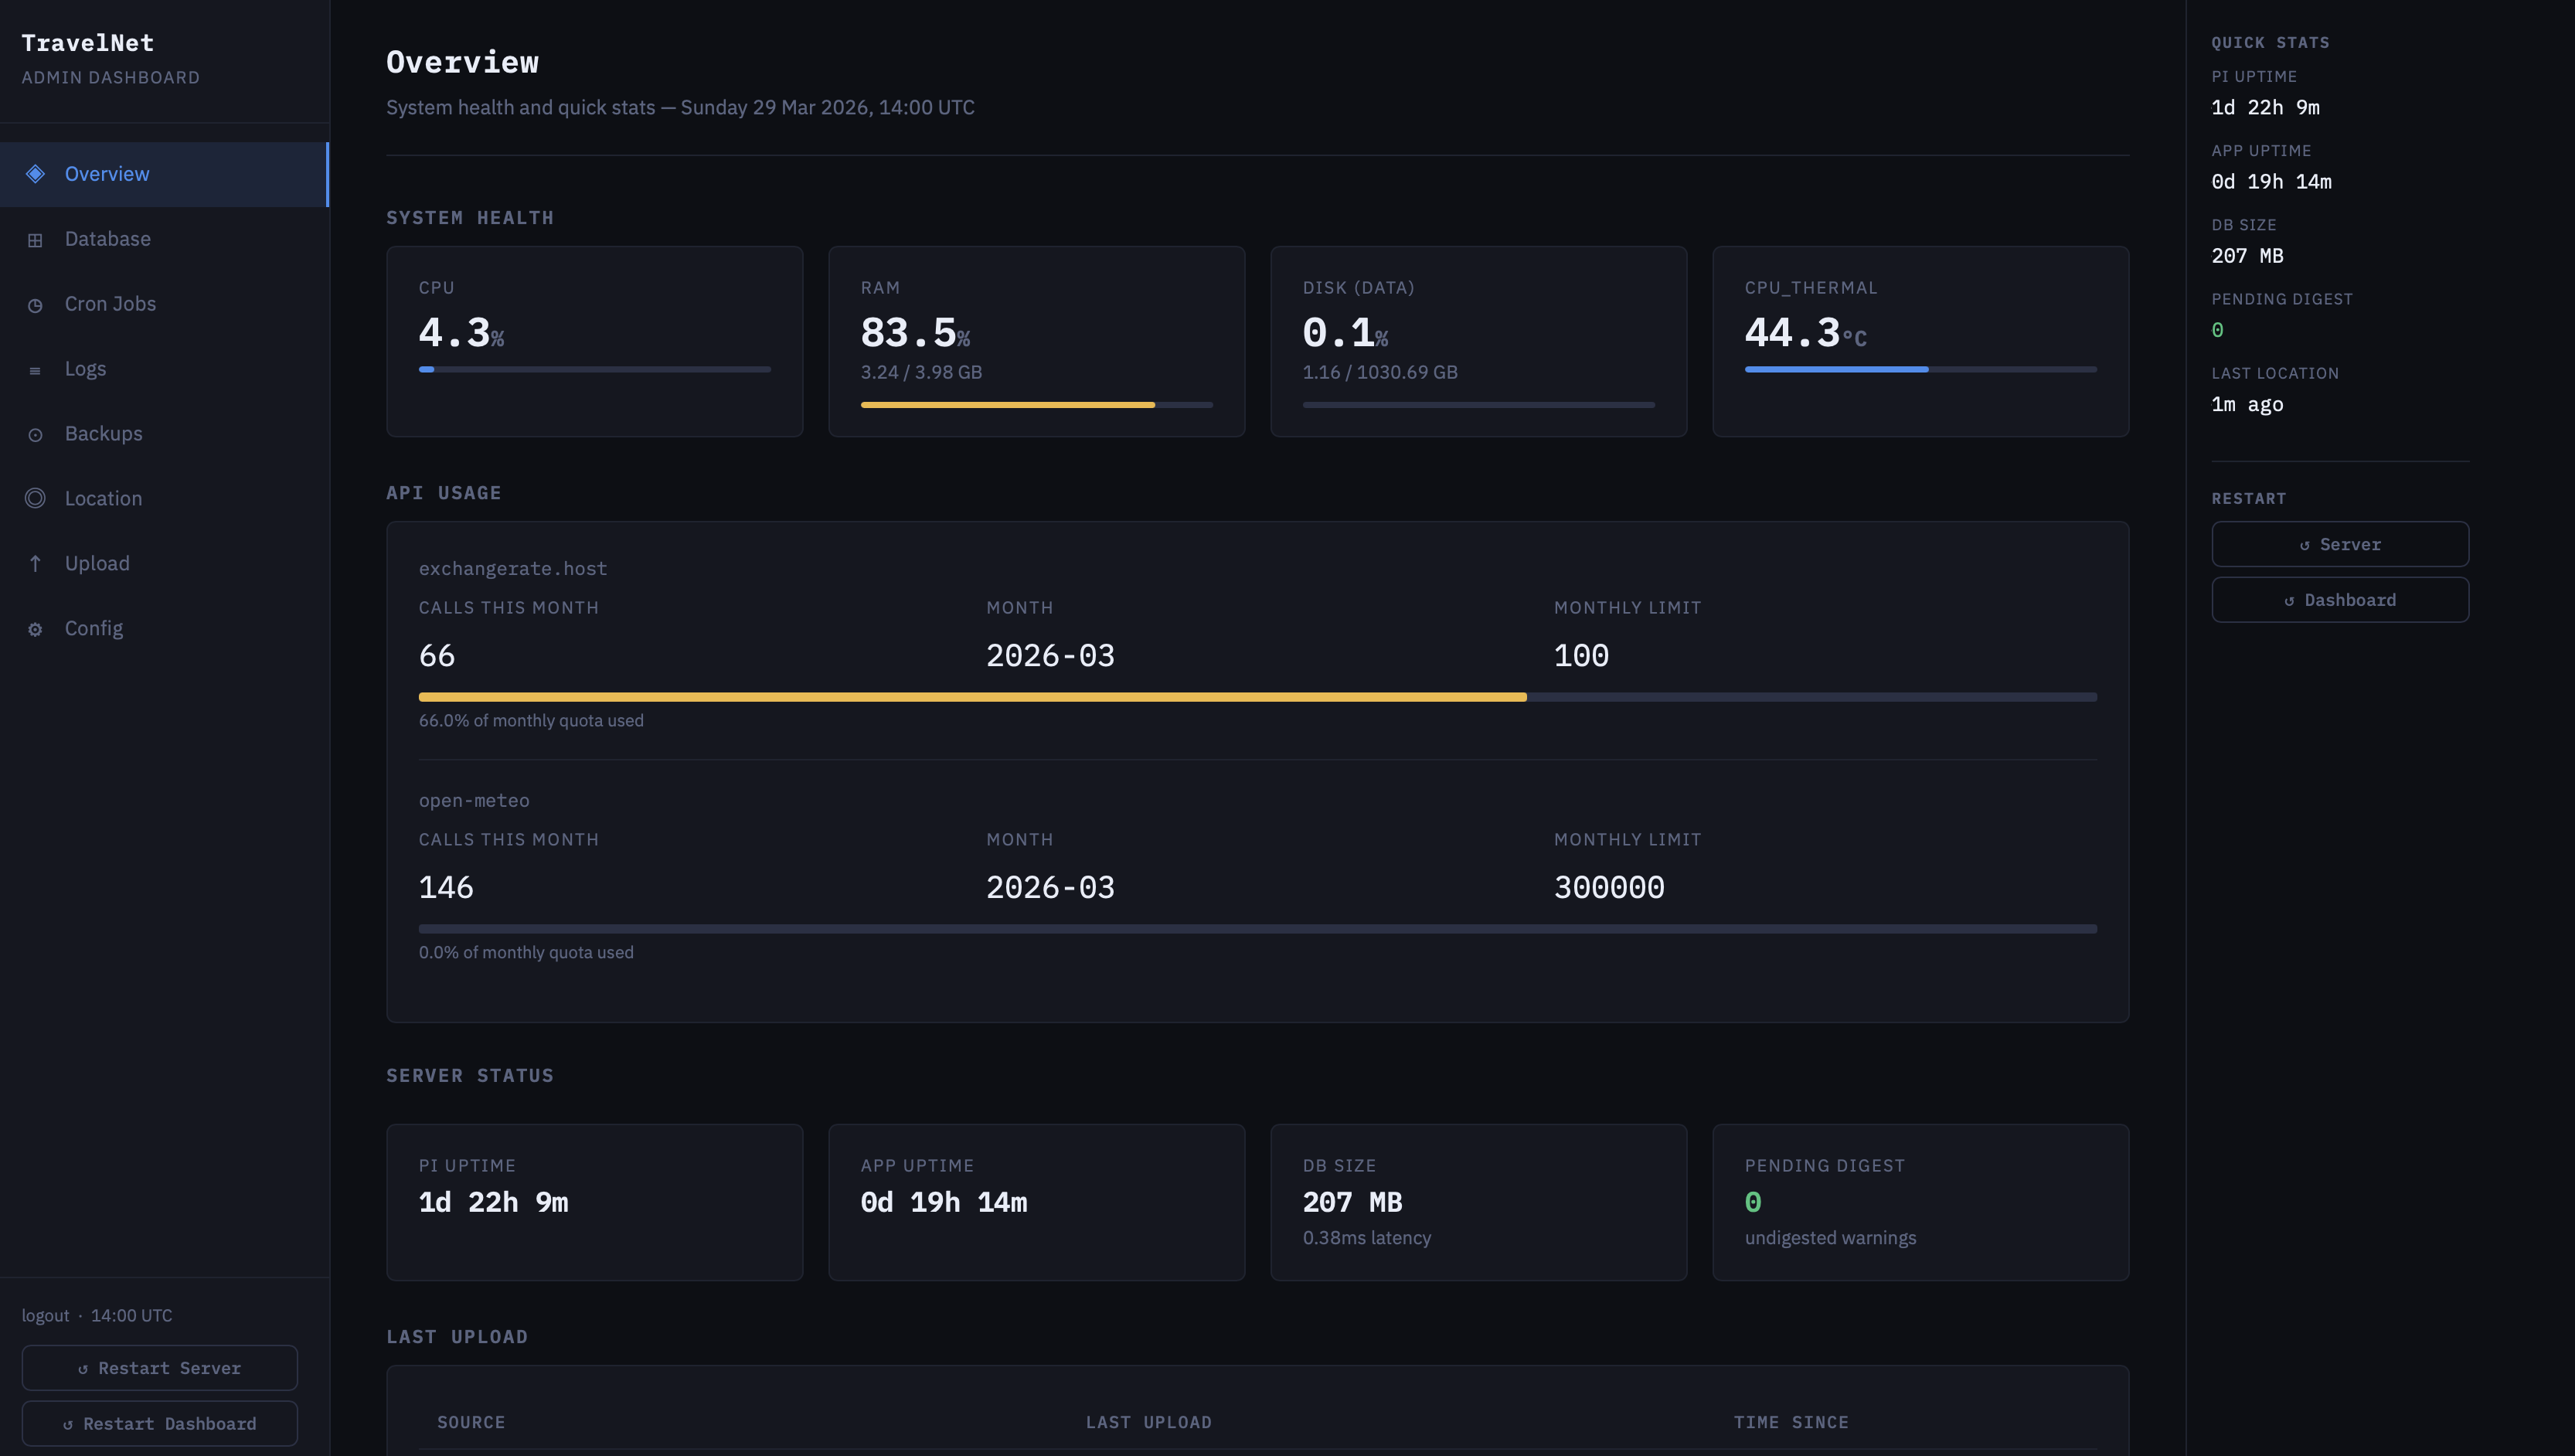
As powerful and brave as my little Pi 4b is for taking on this extreme project, it isn’t the fastest machine in the world, which is fine! For most things I don’t need super fast responses, but when the dashboard can take up to 10 seconds to load the database page when I just wanted to see if a column name updated, well that’s when the Pi needs a helping hand. Enter, the Overview!
This page provides everything I could want (apart from logs, more on that later) at a quick glance. All the system’s important information including:
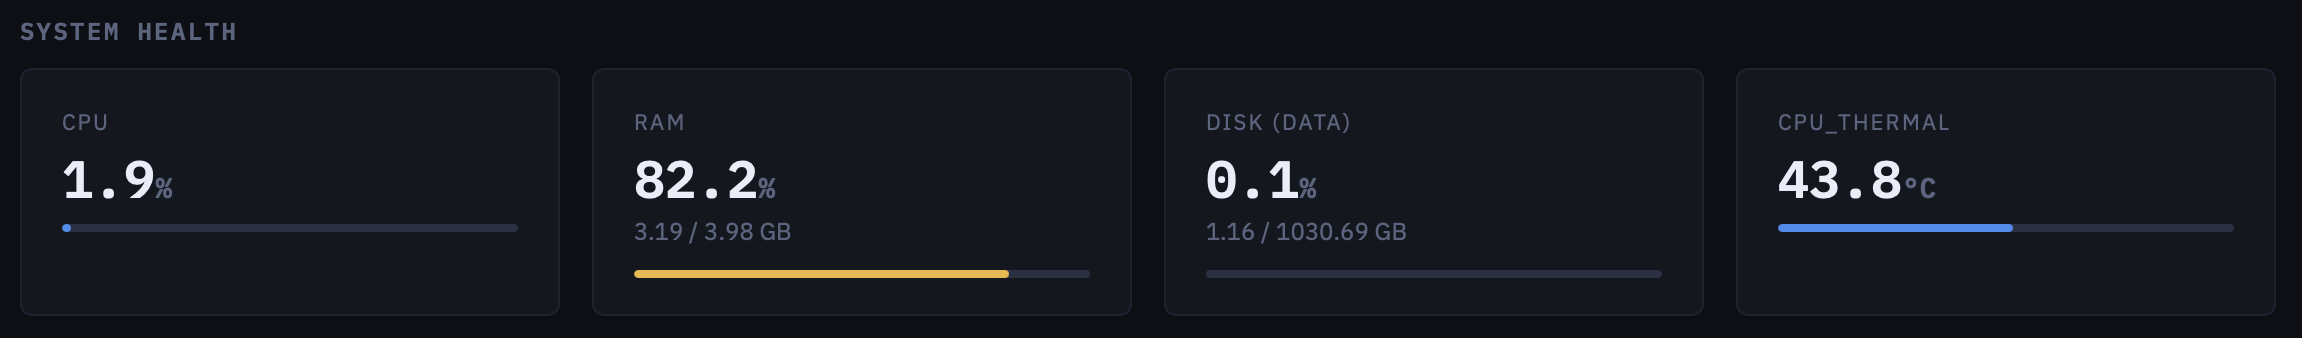
- System health: The state of the actual Pi; CPU and RAM usage, temperature and disk utilisation.
- API Usage: How many calls I have made to various API services since they were last reset? OpenMeteo is very generous and offers 300,000 requests each month, but the same can’t be said for exchangerate.host and it’s measly 100. But that’s still plenty!
- Server status: The state of the Travelnet service: uptime (both service and Pi), database size and undigested logs of warnings and errors.
- Last uploads: Needless to say this is super useful. At a quick glance I can see the newest entry for locations (both Overland and Shortcuts), health, FX rates, transactions and more. It even has a useful “Time Since” badge that turns orange/red if an upload is stale!
- Database tables: Another really useful section. Shows each table in the database, it’s name and current row count, and if it is resettable via the dashboard or not. Also contains a “View” button to quickly inspect the full table.
- Backups: Latest backup date for each type of data. Includes the whole database (both local and remote copies), individual transaction sources (Wise, Revolut), location, health and more.
Database
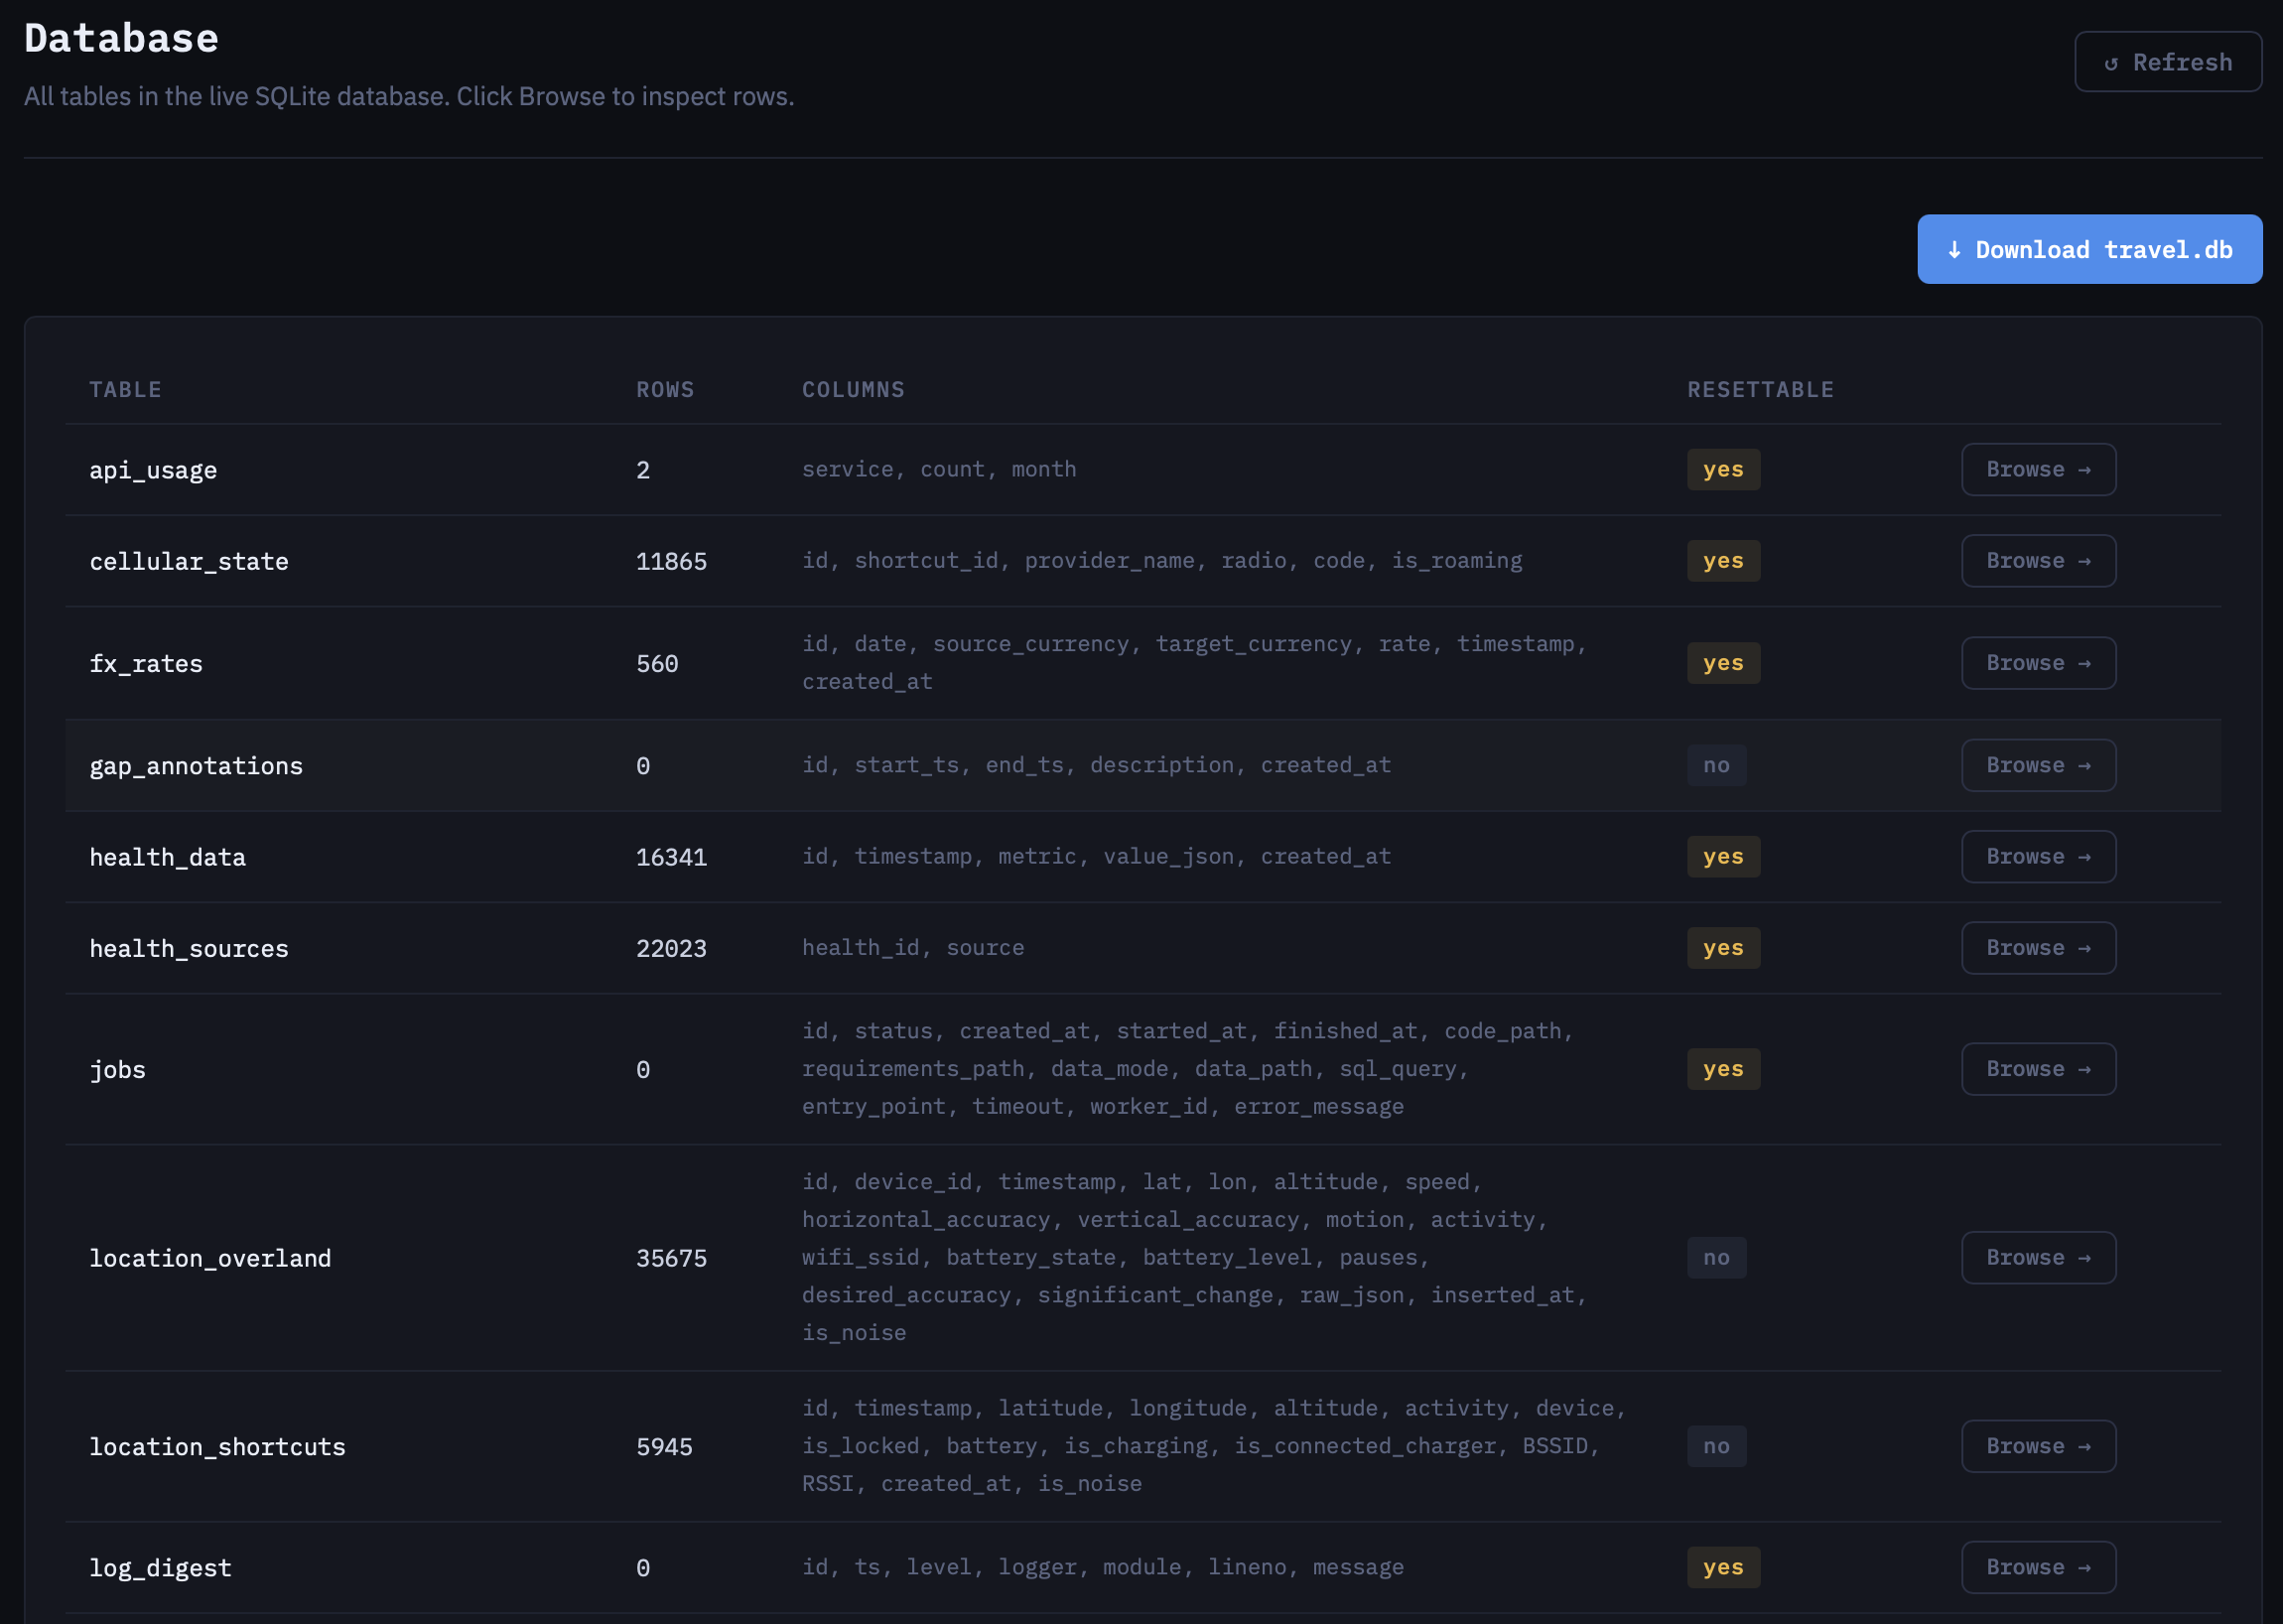
The beating heart of the entire project; no database means literally no TravelNet. In the early stages of development, I could actually view the entire database within VSCode. This was great as it meant I didn’t even have to leave my IDE to see if new data had been inserted. However, as time passed and more and more location and health data was uploaded, and the database continued to grow, opening it in VSCode got slower and slower, to the point where one day it was simply too large to open. This was actually one of the main reasons I decided to make the dashboard in the first place!
This page is an extension of the database table summary in the Overview. It adds column names to easily identify ID key names, SQL views for location (Overland and Shortcut data at once via a JOIN) and weather (hourly and daily), and a download database button to download a full point-in-time copy.
Cron Jobs
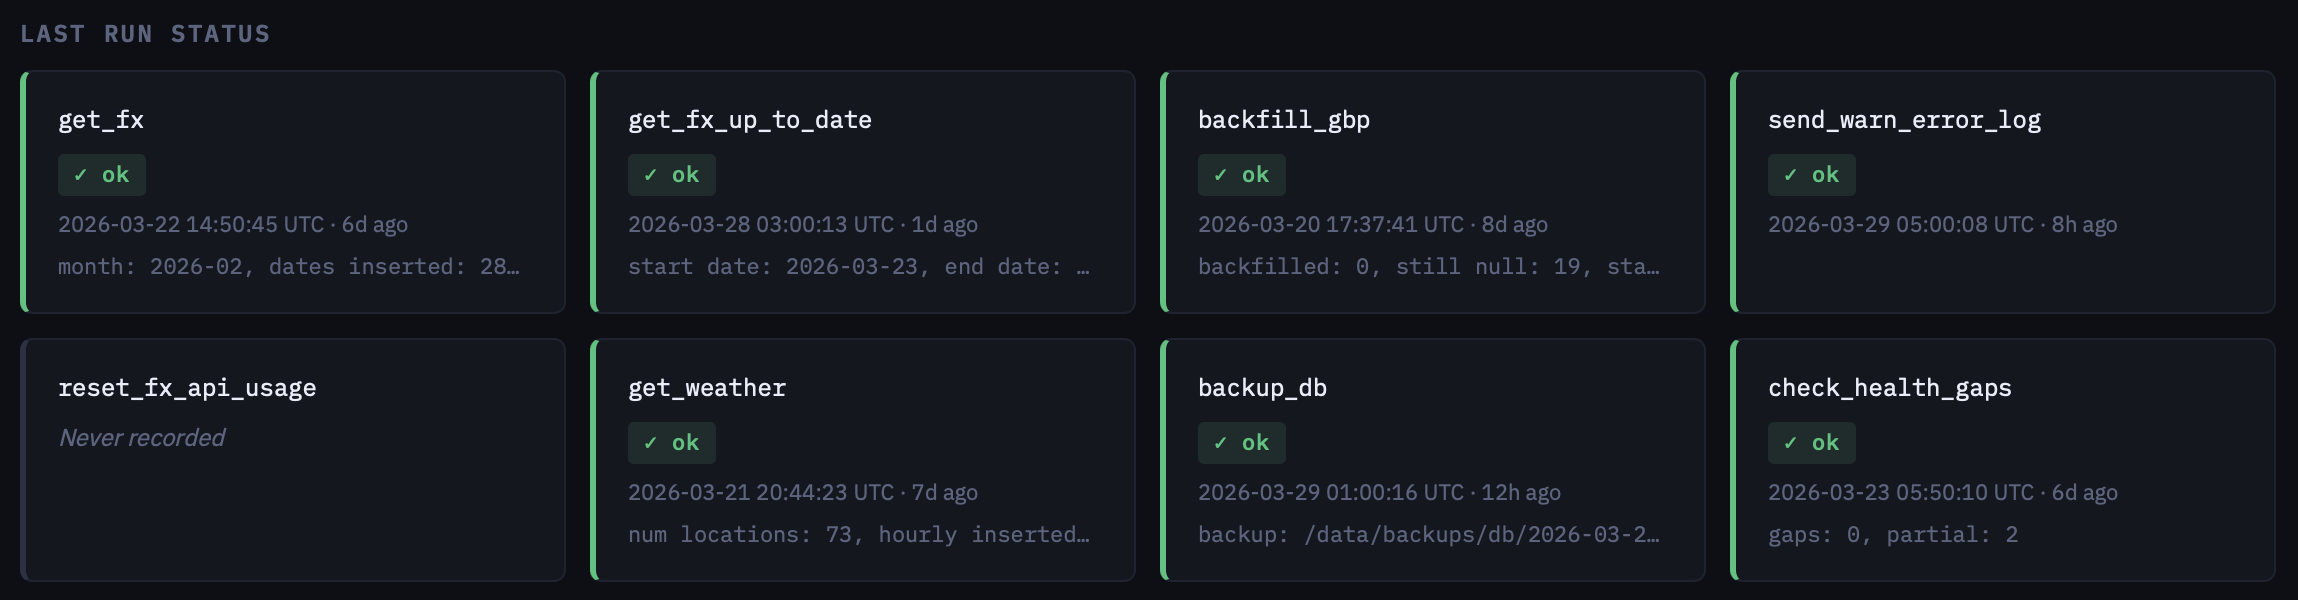
The whole point of the having a server and not just storing all of this on my phone was so that I could not have to worry about it. Simply (well, not simple actually) set it all up before departure and then not touch it until I get to the ML insights bit. Of course no system is ever truly Set and Forget so to help with this we need to do some maintenance regularly! cron is the go-to scheduler for automating regular tasks on Linux.
| Task | Schedule | Description |
|---|---|---|
| Get FX | 02:00 on 2nd | Request FX rates for the previous month from exchangerate.host. A timeframe is used so that only 1 API call is made, and currencies are defined in the config. |
| Get FX Up To Date | 03:00 on 8th/15th/22nd/28th | Check for missing FX rates and request from the earliest missing date to the latest missing date as a timeframe (1 API call). |
| Backfill GBP | 02:30 on 2nd | Check where amount_gbp is NULL in the transactions table and attempt to convert local currency using FX data (which will be fresh as Get FX was called shortly before). |
| Send Warn Error Log | 06:00 daily | Flush all WARNING+ log records as an email. If there are no warnings/errors, no email is sent. |
| Reset FX API Usage | 00:00 on 1st | Reset monthly API call counters |
| Get Weather | 04:00 on 14th | Get weather data (hourly and daily) for the previous 40 days, starting from the 7th. |
| Backup DB | 01:00 on Sunday | Backup full database to local storage. Only the previois 28 days of backups are kept. |
| Check Health Gaps | 05:50 on Monday | Check for missing expected metrics in last week of health data and warn. This will be flushed shortly after completion by Send Warn Error Log |
| Crontab Timezone | 03:00 on 2nd/16th | Update system cron jobs to a new timezone. This is called from my iPhone rather than through cron itself. At the schedule specified, a POST request is sent to /metadata/crontab_tz with my local timezone. This ensures that these jobs run at my local time, rather than the local time of the Pi (GMT or BST, depending on the time of year). |
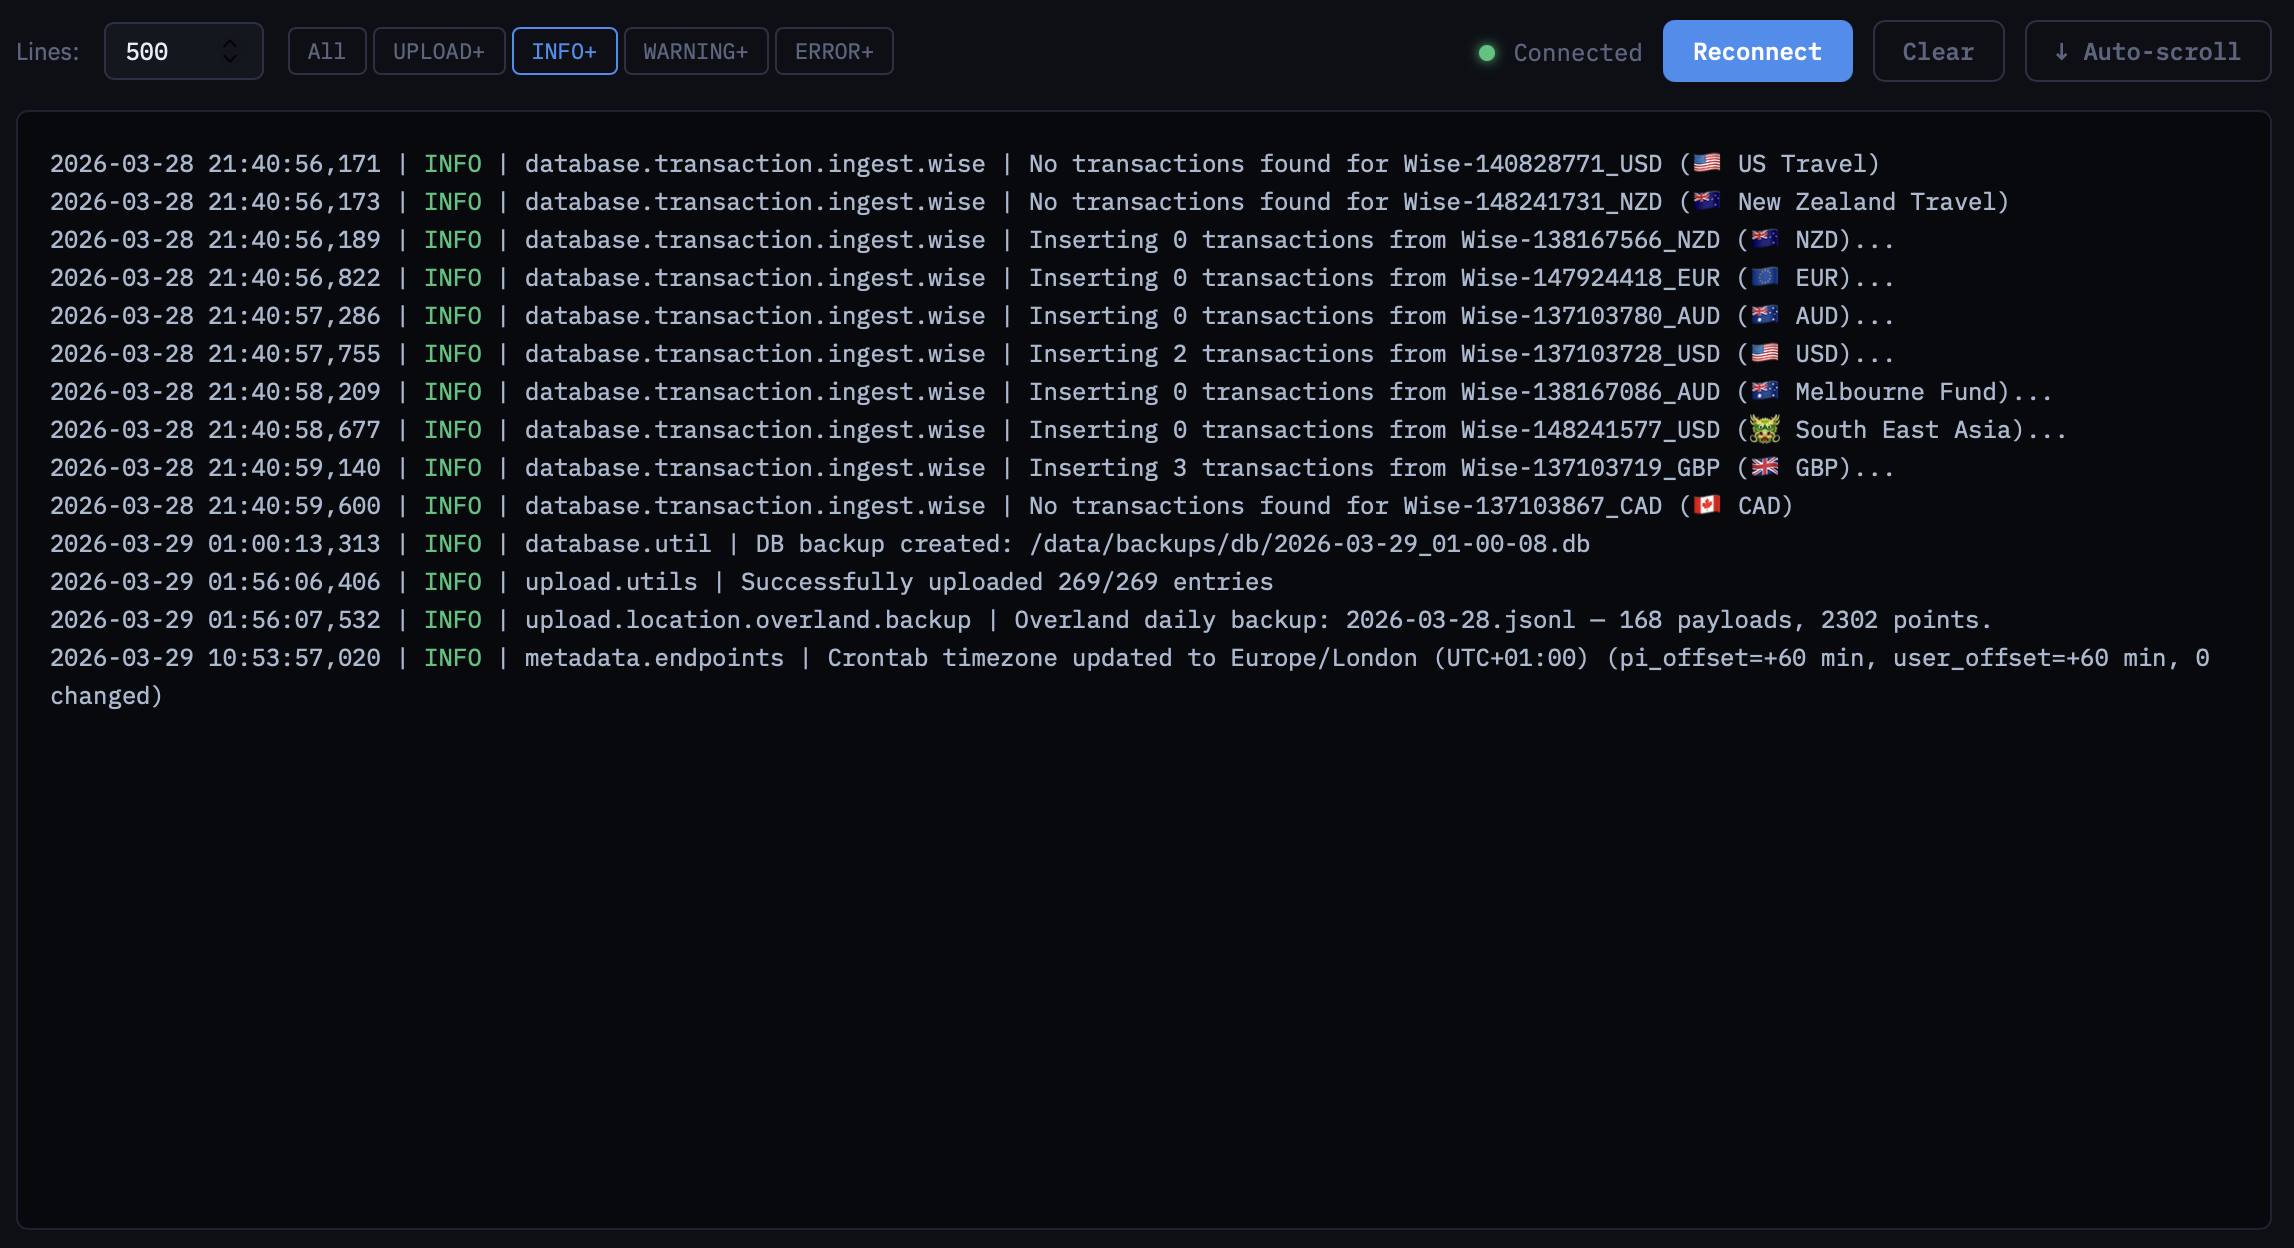
Logs
Do you even use it?
Yes! Discuss how I’ve swapped to dashboard-first management.
##